Ofsted Report and Data
Performance Tables The latest performance tables for Forest Glade Primary
Please find below our most recent Ofsted reports and relevant information from the Department for Education Performance Tables.
Parent View is an online questionnaire launched by Ofsted, that allows parents and carers to give their views on their child's school. Parent View asks for your opinion on 12 aspects of your child’s school. The results can help parents to make informed choices about their child's education and by sharing your views, you’ll be helping us to celebrate our successes and make improvements where necessary.
Please click on the link below to share your views about us with OFSTED
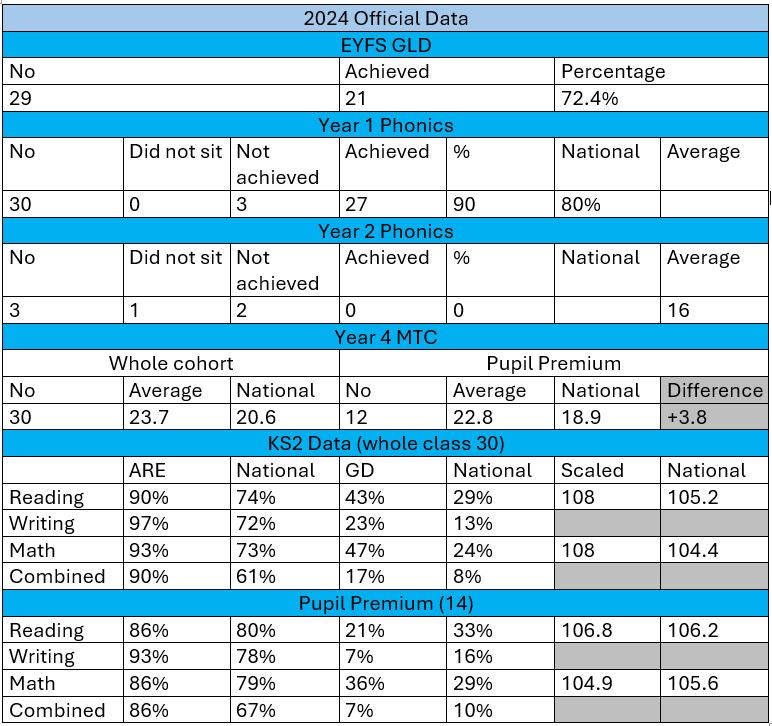
Our most recent end of Key Stage data
Below is our most recent data for EYFS, Year 1 and 2 Phonics, Year 4 Multiplication Tables Check and KS2 outcomes. This is followed by a comparative table of the previous three years of published KS2 data as well as the national data.
|
Historic KS2 Performance Data |
||||||||||||||||||
|
|
2019 |
2022 |
2023 |
National 2023 |
||||||||||||||
|
|
% Working at ARE |
% Working at Greater Depth |
Average Scaled Score |
Progress Score |
Progress Measure |
% Working at ARE |
% Working at Greater Depth |
Average Scaled Score |
Progress Score |
Progress Measure |
% Working at ARE |
% Working at Greater Depth |
Average Scaled Score |
Progress Score |
Progress Measure |
% Working at ARE |
% Working at Greater Depth |
Average Scaled Score |
|
Reading |
83% |
31% |
105.7 |
+1.58 |
Average |
97% |
57% |
112 |
6.1 |
Well above Average |
100% |
50% |
110 |
3.77 |
Sig+ |
73% |
29% |
105 |
|
Writing |
90% |
31% |
|
+2.65 |
Well above Average |
90% |
17% |
|
2.9 |
Well above Average |
100% |
17% |
|
2.56 |
Sig+ |
71% |
13% |
|
|
Maths |
97% |
24% |
106.1 |
+1.56 |
Average |
97% |
43% |
109 |
5.5 |
Well above Average |
100% |
43% |
109 |
4.18 |
Sig+ |
73% |
24% |
104 |
|
GPS |
97% |
34% |
108.4 |
|
|
90% |
38% |
109 |
|
|
100% |
40% |
108 |
|
|
72% |
30% |
105 |
|
Combined |
79% |
17% |
|
|
|
90% |
17% |
|
|
|
100% |
7% |
|
|
|
59% |
8% |
|


